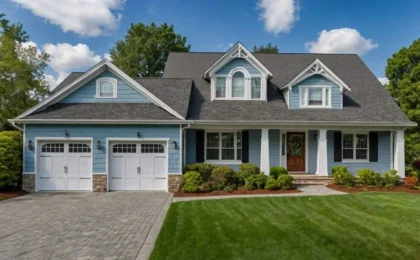


The American housing market stands at a precarious crossroads in 2026. Years of record-high home prices, coupled with persistent, elevated mortgage rates, have fundamentally altered the landscape of homeownership. What was once viewed as the cornerstone of the "American Dream"—a stable, attainable path to generational wealth—has increasingly become an elusive goal for millions. As the nation grapples with this systemic affordability crisis, migration patterns, consumer behavior, and the very concept of residential stability are undergoing a profound transformation.
Main Facts: A Market Under Pressure
The current housing crisis is defined by a lack of activity. With many homeowners locked into low-interest rates obtained prior to the current cycle, there is little incentive to sell, leading to a persistent shortage of inventory. Simultaneously, would-be buyers are facing a "double-whammy" of record-high home prices and financing costs that remain stubbornly elevated.
The result is a stagnant market where the volume of transactions has thinned. For those still attempting to break into the market, the search has become a cross-country endeavor, forcing a shift away from the traditional high-cost coastal hubs and toward the heartland. This shift represents a departure from the pandemic-era trends that saw a massive influx of residents into the Sun Belt. As affordability tightened in Florida, Texas, and Arizona, buyers are now turning their eyes toward the Midwest, where space is more abundant and the local economies have not yet experienced the explosive, tech-driven valuation spikes that defined the Pacific and Atlantic coasts in the early 2000s.
The Chronology of a Crisis
To understand the current state of the market, one must look back to the early 2020s.
2020–2021: The Pandemic Catalyst
The onset of the COVID-19 pandemic triggered a surge in demand for housing. As remote work became the new norm, families sought more space, leading to a migration boom toward the Sun Belt. Cities like Austin, Phoenix, and Miami saw unprecedented price growth as competition for limited inventory skyrocketed.
2022–2024: The Rate Shock
As the Federal Reserve began raising interest rates to combat rampant inflation, mortgage rates surged. This effectively slammed the brakes on affordability. The "lock-in effect" took hold, where homeowners with sub-3% mortgage rates opted to stay put rather than sell and trade into a 7% mortgage, further depleting the supply of homes for sale.
2025–2026: The New Equilibrium
By 2026, the market has reached a state of fragile stability. While prices have not collapsed, the velocity of home price appreciation has slowed significantly. In some previously "overheated" markets, we have seen marginal price corrections, but for the average American, the share of income required to cover housing costs remains significantly higher than it was at the start of the decade.
Supporting Data: Where Affordability Lives
Current analysis reveals a stark divide between states that remain accessible to the average earner and those that continue to demand a significant portion of a household’s monthly income.
The Most Affordable States
According to recent data, the most affordable states are concentrated in the Midwest and the South. In these regions, a median-earning household typically spends roughly 27% of their monthly income on housing—a figure that sits comfortably below the 30% threshold traditionally considered the limit for "affordable" housing.
| State | Share of Income for Housing | Median Household Income | Median Sale Price |
|---|---|---|---|
| Iowa | 25.8% | $81,442 | $269,058 |
| Indiana | 26.6% | $78,076 | $288,896 |
| Oklahoma | 26.8% | $70,570 | $261,681 |
| Ohio | 27.9% | $77,459 | $279,126 |
| Louisiana | 28.3% | $65,922 | $265,083 |
It is worth noting that while these states offer relative relief, they are not immune to the inflationary pressures of the broader economy. Residents in these states have seen their housing costs climb in real terms, even if they remain the most accessible in the country.
Where Affordability Is Improving
Interestingly, while affordability is a struggle, the data shows that in some regions, the situation is slowly improving. This isn’t necessarily because home prices have plummeted, but because wage growth and a slight cooling in demand are beginning to rebalance the scales.
States like Oregon and Washington have seen the largest year-over-year improvement, with the share of income required for housing dropping by 3.6 percentage points. This suggests that in the most expensive markets, the market is finally reaching a ceiling where buyer exhaustion is forcing a correction.
Official Responses and Expert Analysis
The crisis has caught the attention of policymakers and economists alike. Daryl Fairweather, Chief Economist at Redfin, notes that the problem is rooted in a fundamental supply-side failure.
"Since 2020, the share of income a median-earning American household has to spend on housing has climbed from 23% to over 34%," Fairweather explains. "High mortgage rates are pricing out buyers, but those rates are determined by inflation and economic growth—factors largely outside the control of the housing market. What we can control is the permitting and zoning of housing. It will take a concerted effort to make the policy changes necessary to increase supply and bring down housing costs."
This sentiment is echoed by housing advocates who argue that the "American Dream" is currently being stifled by restrictive local zoning laws that prevent the development of "missing middle" housing—such as townhomes, duplexes, and accessory dwelling units—which could provide more entry-level options.
Implications for the Future: Will Prices Ever Drop?
A common question among prospective buyers is whether we should expect a widespread decline in home prices. The consensus among analysts is that a national crash is unlikely. Instead, the market is expected to undergo a "slow rebalancing."
The "Normalization" Path
The path to affordability will likely be paved by a combination of factors:
- Income Growth: As wages catch up to the cost of living, the relative burden of a mortgage payment decreases.
- Inventory Growth: As more homes are built and as aging homeowners eventually look to downsize, the supply-demand mismatch may begin to ease.
- Market Cooling: We are already seeing evidence of this in markets like Austin and San Antonio, where the post-pandemic frenzy has faded, leading to price stabilization or even modest declines.
Societal Shifts
The broader implication is a change in how Americans view their lifestyle. The "bigger is better" mentality of the 2010s is being replaced by a pragmatic focus on proximity to jobs, local cost of living, and total debt-to-income ratios. The rise of the Midwest as a destination for young families is a testament to this shift. When the coasts become prohibitively expensive, the American workforce displays a remarkable capacity to migrate toward value.
Conclusion: A Long Road Ahead
The U.S. housing market is currently navigating a period of necessary recalibration. While the statistics regarding income-to-housing ratios are sobering, they also provide a roadmap for where the next generation of American growth might occur.
For the average household, the key to navigating this era is a focus on long-term stability over short-term speculation. Whether that means relocating to a more affordable state, waiting for the market to further correct, or advocating for policy changes in their local communities, the path forward requires a new approach to homeownership. As we look toward the remainder of 2026 and beyond, the focus will remain on building a housing ecosystem that is not just an investment vehicle for the wealthy, but a functional foundation for the American middle class.
Methodology Note
This analysis expands on a comprehensive June 2026 Redfin report. It evaluates all 50 U.S. states based on the percentage of median household income required to afford a typical for-sale home. A state is classified as "affordable" if the monthly mortgage payment—factoring in a 20% down payment, prevailing interest rates, and typical local taxes—consumes 33% or less of the statewide median monthly income. Data is derived from an integrated analysis of Multiple Listing Service (MLS) records, U.S. Census Bureau demographic data, and the Atlanta Federal Reserve’s economic metrics.