
For the first time in half a century, the fundamental calculus of the American real estate market has been turned upside down. Historically, the "new car smell" of a freshly constructed home commanded a significant premium—a financial hurdle that buyers cleared in exchange for modern amenities, energy efficiency, and the lack of deferred maintenance. However, as of the first quarter of 2026, that paradigm has shattered.
Data now confirms a historic inversion: new single-family homes are selling for less than existing ones. This shift, driven by a combination of aggressive builder incentives, a contraction in home sizes, and a "sticky" resale market where sellers refuse to lower their expectations, marks a watershed moment for the U.S. housing economy.
Main Facts: A Historic Statistical Pivot
According to data compiled by the National Association of Home Builders (NAHB), drawing from the U.S. Census Bureau and the National Association of Realtors (NAR), the median price of a new single-family home in the first quarter of 2026 stood at $403,200. In a startling reversal of historical norms, this figure landed $1,400 below the median existing-home price of $404,600.
This is not a momentary statistical blip. The first quarter of 2026 marks the fourth consecutive quarter in which existing homes have outpriced new builds—a streak that traces its origins back to the second quarter of 2024. To understand the gravity of this shift, one must look at the long-term averages. Since 1987, new homes have typically carried a 16% price premium over the resale market. As of April 2026, that premium has plummeted to -2%. According to John Burns Research & Consulting, this is the first time the premium has entered negative territory in data stretching back five decades.
The inversion is the result of two opposing forces: corporate agility and individual inertia. Homebuilders, functioning as corporations with high holding costs and a need to move inventory, have pivoted their strategies to meet the reality of high interest rates. Conversely, individual homeowners—often insulated by low-rate mortgages—have created a supply chokehold, keeping existing home prices artificially elevated despite a cooling broader economy.
Chronology: The Road to the Inversion (2022–2026)
The path to this pricing anomaly began in the wake of the post-pandemic housing boom.
- 2022–2023: The Rate Shock: As the Federal Reserve aggressively hiked interest rates to combat inflation, mortgage rates climbed from historic lows of 3% to over 7%. This created the "lock-in effect," where homeowners with low-interest debt became unwilling to sell, fearing the cost of a new mortgage at double the rate.
- Early 2024: The Inflection Point: By the second quarter of 2024, the inventory of existing homes remained at historic lows. Builders, realizing that the "luxury" market was saturated and that affordability was the primary barrier for buyers, began to shift their production models. They started building smaller, more efficient homes and offering aggressive financing "buydowns."
- 2025: The Year of the Incentive: Throughout 2025, builders doubled down on incentives. While existing home sellers held onto their 2022 price expectations, builders were slashing prices or covering closing costs. By the fourth quarter of 2025, nearly 20% of new homes saw outright price cuts.
- Q1 2026: The New Reality: The cumulative effect of these strategies resulted in the median price flip. New homes became the "value" play in the market, while existing homes became the "luxury" or "premium" option due to their scarcity and established locations.
Supporting Data: Shrinking Footprints and Regional Divides
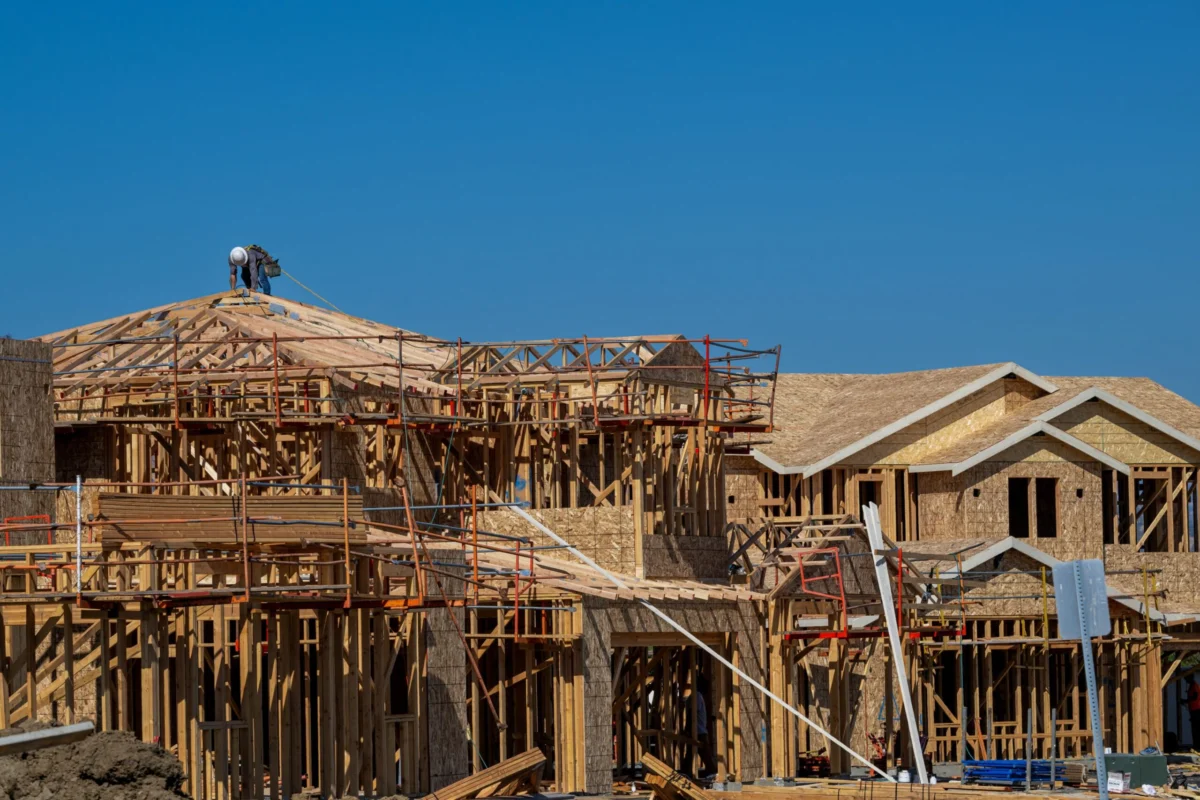
The price inversion is not merely a result of builders being "generous"; it is a result of builders being pragmatic. One of the primary drivers of lower new-home prices is the physical contraction of the product.
The Shrinking American Home
Builders have significantly reduced the median size of new homes to keep them within reach of the average buyer.
- Mid-2010s: Median new home size was approximately 2,700 square feet.
- 2022: Median size dropped to 2,500 square feet.
- 2026: Median size has contracted to roughly 2,400 square feet.
By building on smaller lots and reducing square footage, builders have effectively lowered the "sticker price," even as the price per square foot may remain high. Furthermore, construction has shifted heavily toward the Sunbelt, where land is more plentiful and regulatory hurdles are often lower than in the Northeast.
Regional Disparities
The national median masks a stark geographic divide. The "discount" on new homes is largely a phenomenon of the South and West.
- The Northeast: New homes still carry a massive $309,200 premium over existing ones, driven by extreme land scarcity and high regulatory costs.
- The Midwest: New homes maintain a $66,800 premium.
- The West: The discount flips, with existing homes costing $55,500 more than new builds.
- The South: The gap has narrowed to a mere $700, with new homes increasingly likely to underprice the resale market as supply continues to flood Sunbelt metros.
The "Hidden" Discount
Alex Thomas, research manager at John Burns Research & Consulting, notes that the Census data likely understates the true discount. Builders are employing "off-book" incentives that don’t reflect in the recorded sales price. These include:
- Mortgage Rate Buydowns: Builders paying to lower a buyer’s interest rate from 6.5% to 4.5% for the first few years.
- Design Credits: Offering $20,000 in free upgrades.
- Closing Costs: Covering 3% to 5% of the purchase price in fees.
John Burns’ survey work suggests these incentives represent 7% to 8% of the total sale price—a level Thomas describes as "pretty abnormal" by historical standards.
Official Responses and Expert Analysis
The housing industry’s leading voices point to a fundamental asymmetry in the motivations of sellers.
Alex Thomas of John Burns Research & Consulting told Fortune that the data reflects "old-fashioned supply and demand." He emphasized the "stickiness" of the resale market. "Existing home prices are sticky on the way down," Thomas explained. "Resellers want the same prices their neighbors got a year or two ago… Existing owners can delist and wait out the market, whereas builders have to move inventory given holding costs."
The NAHB has also highlighted the headwinds facing builders. Despite the lower selling prices, construction costs remain elevated. Tariffs on building materials—ranging from lumber to steel—have added an estimated $9,200 to the cost of the average new home. This puts builders in a vice: they must lower prices to attract buyers in an affordability crisis, even as their "input" costs continue to rise.
From a generational perspective, the National Association of Realtors (NAR) 2026 report paints a picture of a market dominated by Baby Boomers. Boomers now account for 42% of all buyers and 55% of all sellers. Because many in this demographic own their homes outright or have significant equity, they are under no financial pressure to sell. This "equity-fueled flexibility" allows them to hold out for peak pricing, further detaching the resale market from the economic reality facing younger, first-time buyers.
Implications: The Frozen Market and the Future of Ownership
The current inversion has profound implications for the U.S. economy and the future of the "American Dream."
The First-Time Buyer Crisis
The affordability crisis has reached a breaking point. The average age of a first-time homebuyer hit a record high of 40 in 2025. Simultaneously, the share of first-time buyers in the market has fallen to 21%—the lowest since NAR began tracking the metric in 1981. For these buyers, the new-home market is no longer the "upgrade" but the "entry point." If builders continue to shrink footprints and offer financing help, the new-home sector may become the only viable path to ownership for those without existing equity.
The "Rate-Lock" Trap
The market remains haunted by the gap between the average outstanding mortgage rate (roughly 4.3%) and the prevailing market rates (hovering around 6.5%). This 2.2% spread acts as "golden handcuffs" for millions of Americans. Until market rates drop or existing home prices see a significant correction, transaction volumes are expected to remain depressed.
The Demographic Bottleneck
Meredith Whitney, the analyst famous for her 2008 crisis predictions, has noted a emerging social crisis: the "trapped" senior. While Boomers hold a massive share of large, 3+ bedroom homes (28% compared to just 16% for Millennials with children), many cannot afford to move into assisted living or downsize into smaller units that are now similarly priced. This creates a bottleneck where young families cannot move into "starter" homes because seniors cannot move out of them.
Conclusion: A Market in Transition
The fact that a brand-new home is now a "better deal" than a decades-old house is a sign of a housing market in deep transition. It suggests that the traditional housing ladder has been broken. While builders have shown a remarkable ability to adapt—shrinking homes and subsidizing interest rates—the broader resale market remains frozen in time, clinging to the valuations of a low-interest era that has long since passed.
For prospective buyers, the takeaway is clear: the deals are currently in the dirt and the drywall of new construction. But for the broader economy, the inversion is a warning sign of a market where supply and demand are no longer speaking the same language. Until existing home sellers accept the new reality of higher rates, or until rates fall enough to unlock the "golden handcuffs," the new-home discount is likely to persist, standing as a monument to a uniquely distorted era in American real estate.