
As the calendar turns deeper into 2026, the American dream of homeownership finds itself at a critical crossroads. For millions of citizens, housing affordability has evolved from a routine financial planning exercise into the single greatest economic hurdle of the decade. Following the explosive, pandemic-fueled real estate boom that saw valuations skyrocket to historic highs, the market is now settling into a complex, nuanced reality. While the frantic price surges of the early 2020s have decelerated, the residual effects remain: the typical American homebuyer is currently allocating nearly 40% of their monthly income to housing costs—a figure that significantly eclipses the traditional "30% rule" of personal finance.
Yet, beneath the national headlines of stagnation and high costs, there is a shifting geography of opportunity. From the industrial heartlands of the Rust Belt to the tech-driven corridors of the West Coast, the narrative of affordability is no longer monolithic.
Main Facts: A Market in Transition
The core tension in the 2026 housing market lies in the disparity between household incomes and home price appreciation. According to recent data from Redfin, the national benchmark for affordability—defined as spending 30% or less of household income on monthly housing payments—is being consistently challenged.
While the national average for housing expenditure sits at roughly 37%, specific pockets of the country are bucking this trend. Cities in the Midwest and parts of the South have emerged as sanctuaries of stability. In these regions, lower entry price points and rising local wages have kept the dream of homeownership firmly within the reach of the middle class. Conversely, coastal hubs are experiencing a different phenomenon: a "reset" phase where, despite exorbitant price tags, the relative cost of entry is beginning to soften as wages finally start to outpace the cooling home-price growth.
Chronology: From Pandemic Peak to the 2026 Reset
To understand today’s market, one must look back at the chaotic timeline of the last five years:
- 2020–2022 (The Great Acceleration): The pandemic triggered a seismic shift in demand. Historically low mortgage rates and a sudden, widespread need for home office space sparked a nationwide bidding war. Inventory plummeted as home prices grew at double-digit annual rates, pushing millions of first-time buyers to the sidelines.
- 2023–2024 (The Plateau): As the Federal Reserve adjusted monetary policy to combat inflation, mortgage rates rose sharply. This acted as a "cold shower" for the market. While demand softened, supply remained tight, preventing a true price collapse and keeping affordability near record lows.
- 2025 (The Turning Point): By mid-2025, a critical shift occurred. Home-price growth began to cool significantly, while consistent wage growth—driven by competitive labor markets—began to narrow the gap between earnings and debt-to-income requirements.
- 2026 (The Current Landscape): We are currently in a phase of slow, steady correction. Affordability is technically improving on a national scale, though the "feeling" of affordability has yet to catch up to the data, as legacy prices remain high relative to pre-pandemic baselines.
Supporting Data: The Geography of Affordability
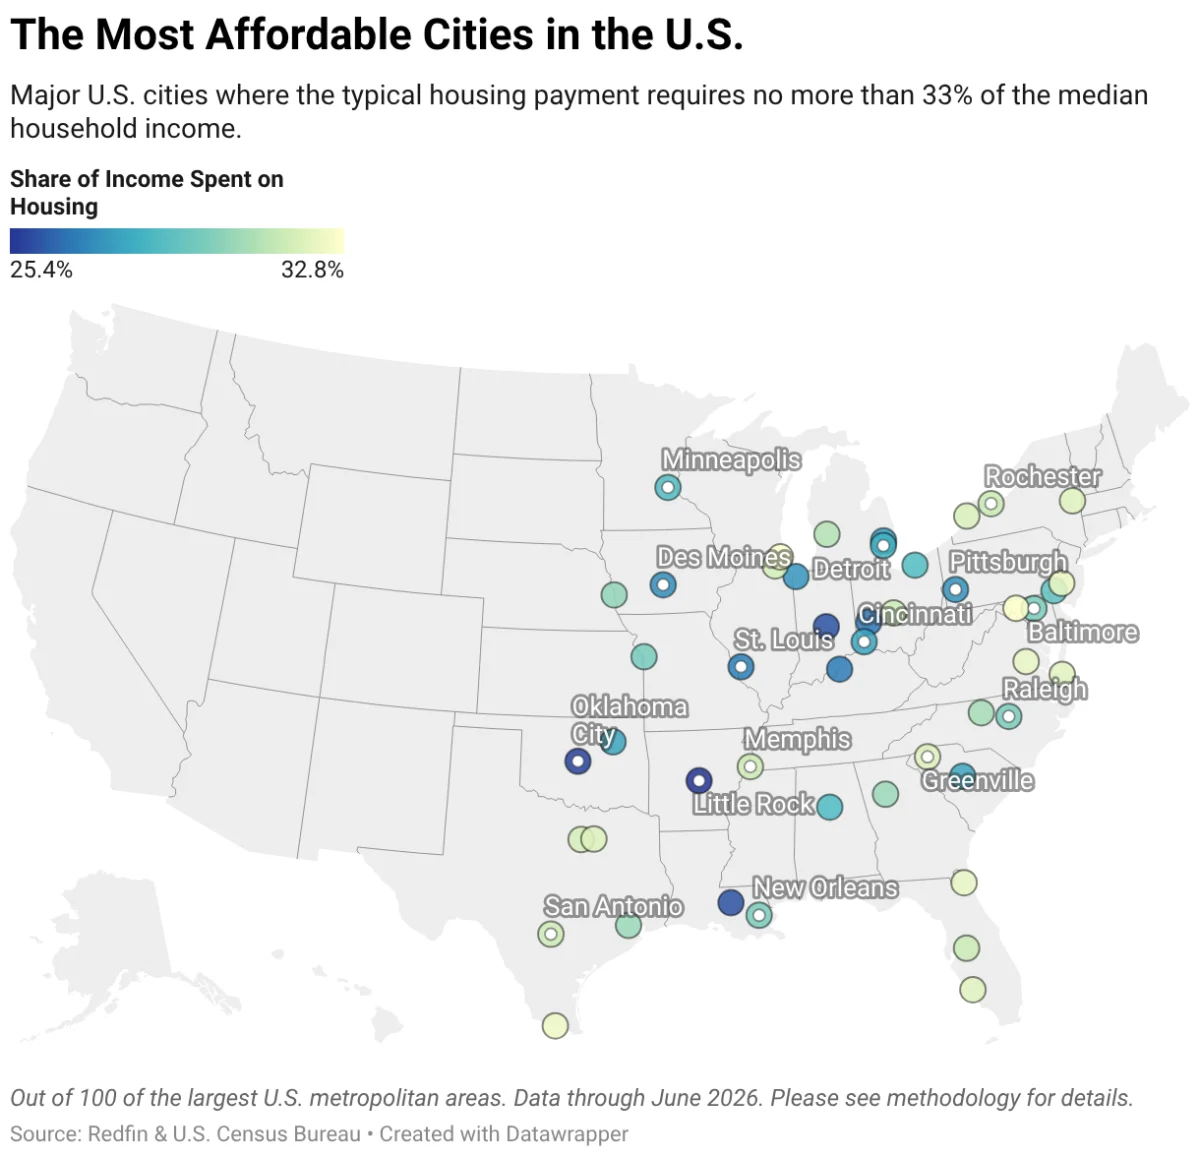
The data paints a clear picture: if you are looking for value, the Great Lakes and the American Midwest are currently the nation’s most fertile ground.
The Top 10 Most Affordable Cities
| City | Share of Income Required | Median Household Income | Median Sale Price |
|---|---|---|---|
| Little Rock, AR | 25.4% | $73,170 | $259,224 |
| Oklahoma City, OK | 25.7% | $78,818 | $274,179 |
| Indianapolis, IN | 26.0% | $90,927 | $324,030 |
| Baton Rouge, LA | 26.0% | $76,675 | $279,513 |
| Dayton, OH | 26.7% | $78,105 | $260,221 |
| Louisville, KY | 26.8% | $81,757 | $299,005 |
| St. Louis, MO | 26.9% | $88,593 | $309,075 |
| Des Moines, IA | 27.3% | $93,984 | $319,045 |
| Pittsburgh, PA | 27.4% | $83,419 | $291,527 |
| Gary, IN | 27.5% | $82,274 | $309,075 |
These figures demonstrate that in cities like Little Rock and Oklahoma City, the average worker is well within the healthy 30% affordability threshold, allowing for greater financial flexibility in other areas of life.
Official Perspectives: The Economist’s View
Daryl Fairweather, Chief Economist at Redfin, suggests that the public perception of the market is often lagged. "Nationally, housing affordability has actually improved over the past year," Fairweather notes. "It may come as a surprise to many, given that the memory of soaring home prices and high mortgage rates is still fresh. However, since mid-2025, home-price growth has cooled while incomes have risen, pushing the relative cost of buying down in nearly every major city. We expect this trend of gradual improvement to continue into the coming years."
This sentiment is echoed by regional planners who see the "Rust Belt revitalization" as a long-term structural change. As remote and hybrid work models remain entrenched, the necessity of living in hyper-expensive coastal metros has waned, leading to a migration of talent toward these more affordable, mid-sized cities.
Implications: A Tale of Two Markets
The housing market of 2026 is characterized by two distinct narratives: the Revitalization of the Interior and the Coastal Reset.
The Midwest Renaissance
The industrial cities of the Midwest, long defined by their post-industrial decline, are finding new life. As homebuyers flee the high-cost coasts, these cities are experiencing a surge in demand. While this is excellent for local tax bases and revitalization, it creates a new challenge: a limited and aging housing supply. In cities like Pittsburgh and Cleveland, the influx of new residents is causing prices to rise faster than the national average, a testament to the "hidden gem" status these cities have shed in the last 24 months.
The Coastal Correction
On the other side of the country, cities like San Jose, Seattle, and Los Angeles are seeing the most dramatic improvements in affordability, despite still being among the most expensive places to live. In San Jose, for instance, the share of income required to afford a home has dropped by 7.4 percentage points year-over-year.
However, this is not a universal coastal trend. San Francisco, for example, is becoming less affordable. The localized AI boom in the Bay Area has injected a fresh wave of extreme wealth into the market, driving prices up and decoupling the local real estate market from broader national trends. This creates a high-stakes environment where the "haves" and "have-nots" are increasingly divided by specific industry sectors rather than just geographic location.
Strategic Planning: How Much Home Can You Afford?
For the prospective buyer, the current market requires a disciplined approach. The standard recommendation—keeping housing costs below 30% of gross monthly income—remains the gold standard, though it is a benchmark that most modern households struggle to meet.
To navigate this, experts advise:
- Strict Budgeting: Utilize digital calculators to determine your debt-to-income ratio before even beginning the search.
- Mortgage Pre-approval: In a competitive market, a pre-approval letter is not just a document; it is your "ticket to the table." It signals to sellers that you are a serious, vetted buyer.
- Broadening Horizons: If a primary city is out of reach, look to the surrounding suburbs or secondary metros within the same state. Often, a 30-minute commute can result in a 15% reduction in housing costs.
Conclusion
The 2026 housing market is neither the "Wild West" of the pandemic years nor a stagnant wasteland. It is a market in the midst of a sophisticated recalibration. While the challenges of affordability remain significant, the stabilization of home prices combined with steady income growth offers a glimmer of optimism. For those willing to look toward the Great Lakes, the South, or the cooling coastal markets, the path to homeownership is not only possible but increasingly accessible.
As we look toward the remainder of the year, the key for the American buyer will be agility—the ability to identify which markets are cooling, which are on the rise, and how to align their personal financial goals with the current, evolving economic reality. Whether you are a first-time buyer in Indianapolis or a professional eyeing the shifting markets of the West Coast, the numbers suggest that for the first time in years, the math is starting to favor the buyer.