
The narrative surrounding the 2026 bull market has been dominated by a single, persistent concern: the so-called "narrow breadth" of the rally. Market commentators have frequently warned that the S&P 500’s gains are being driven by an dangerously thin slice of the corporate landscape—specifically, a handful of mega-cap technology giants. However, as the calendar turns toward the final quarter of the year, a curious and counterintuitive trend has emerged. Through the first eight months of 2026, the traditional market-capitalization-weighted S&P 500 is actually trailing its equal-weight counterpart.
This development challenges the prevailing wisdom that a market reliant on a few "titans of tech" is inherently fragile. It invites a deeper examination of how indices function, the historical reality of wealth creation in equity markets, and why investors should perhaps rethink their anxiety over top-heavy indices.
The Core Data: A Tale of Two Indices
To understand the current market environment, one must distinguish between the two primary ways we measure the U.S. stock market. The standard S&P 500, which acts as the primary benchmark for institutional and retail investors alike, is weighted by market capitalization. In this model, the larger a company’s total market value, the more influence it exerts on the index’s daily percentage move.
As of August 28, 2026, the S&P 500 (with dividends reinvested) has posted a solid 13% gain year-to-date. Yet, sitting in its shadow is the S&P 500 Equal Weight Index—an alternative benchmark where every constituent, regardless of its size, carries an equal 0.2% weighting. Surprisingly, this index is up more than 16% so far this year.
The reason for this divergence lies in the concentration of the standard index. The ten largest names—a "murderers’ row" consisting of Nvidia (NVDA), Apple (AAPL), Microsoft (MSFT), Amazon (AMZN), Alphabet Class A and C (GOOGL/GOOG), Broadcom (AVGO), Meta Platforms (META), Micron Technology (MU), and Tesla (TSLA)—currently command a staggering 37% of the index’s total value. When these companies perform well, the S&P 500 soars. When they consolidate or face headwinds, the index drags, even if the "average" company in the index is having a banner year.
Chronology: The Evolution of Market Concentration
The current "narrowness" is not a novel phenomenon, nor is it necessarily a harbinger of a market crash. Historically, market breadth—the number of stocks participating in an upward trend—tends to be tight during the early stages of a bull market and widens as the cycle matures.
- The Early 2020s: The rise of cloud computing and remote-work infrastructure set the stage for Big Tech dominance, as the pandemic accelerated digital transformation.
- 2023–2024: The emergence of generative AI shifted the market’s focus toward companies with massive compute capacity. Investors began aggressively bidding up companies that could provide the "picks and shovels" for the AI revolution.
- 2025: Market concentration reached historic levels, sparking concerns about valuations and the "safety" of index funds.
- 2026 (Year-to-Date): We are seeing the first significant signs of a rotation. As the AI hype cycle moves into an "implementation phase," investors are showing an increased appetite for mid-cap and value-oriented sectors that had previously been ignored, allowing the equal-weight index to outperform the cap-weighted benchmark.
The Pareto Principle and the Nature of Equity Returns
Why does the market seem to rely on so few winners? The answer lies in the Pareto Principle, or the 80-20 rule, which suggests that 80% of consequences come from 20% of causes. In equity markets, this phenomenon is even more extreme.

Research by Hendrik Bessembinder, a professor at the W.P. Carey School of Business at Arizona State University, has fundamentally changed how we view market returns. His seminal work reveals that the "long-term" success of the stock market is essentially a story of extreme outliers. Bessembinder found that if you remove the best-performing 4% of listed companies, the entire net gain for the U.S. stock market since 1926 effectively vanishes, with the remainder of the market collectively matching the returns of risk-free Treasury bills.
This suggests that "narrow breadth" is not a glitch in the system; it is the engine of the system. Innovation and "creative destruction" are the primary drivers of wealth creation. In the digital age, software and silicon are infinitely more scalable than the heavy industrial models of the 20th century. Consequently, when a company like Nvidia or Microsoft finds a breakthrough technology, the market rewards it with a disproportionate share of capital, which in turn drives the index.
Expert Analysis: The AI Imperative
Nicholas Colas, co-founder of DataTrek Research, highlights the critical role of semiconductor advancement in this dynamic. He notes that the market has historically struggled to price in the exponential nature of technological progress—a phenomenon captured by Moore’s Law.
"Since 2023, the power of AI has more than doubled every year," Colas writes. "If that continues for the next five years, AI will be more than 3,000 times more capable than today. This is why global Big Tech is all-in on the technology: not for today’s models, but those in 2031."
From this perspective, the current concentration in the S&P 500 is not merely "gambling" on high-flying tech stocks. It is a rational, long-term bet on the companies best positioned to dominate the computing landscape of the next decade. While macro-economic fears—such as interest rate volatility or geopolitical instability—may cause the correlation between the cap-weighted and equal-weight indices to tighten, the fundamental driver of the 2020s remains the pursuit of technological alpha.
Implications for the Long-Term Investor
For the individual investor, the debate between the S&P 500 (SPY) and the Equal Weight S&P 500 (RSP) boils down to a question of philosophy.
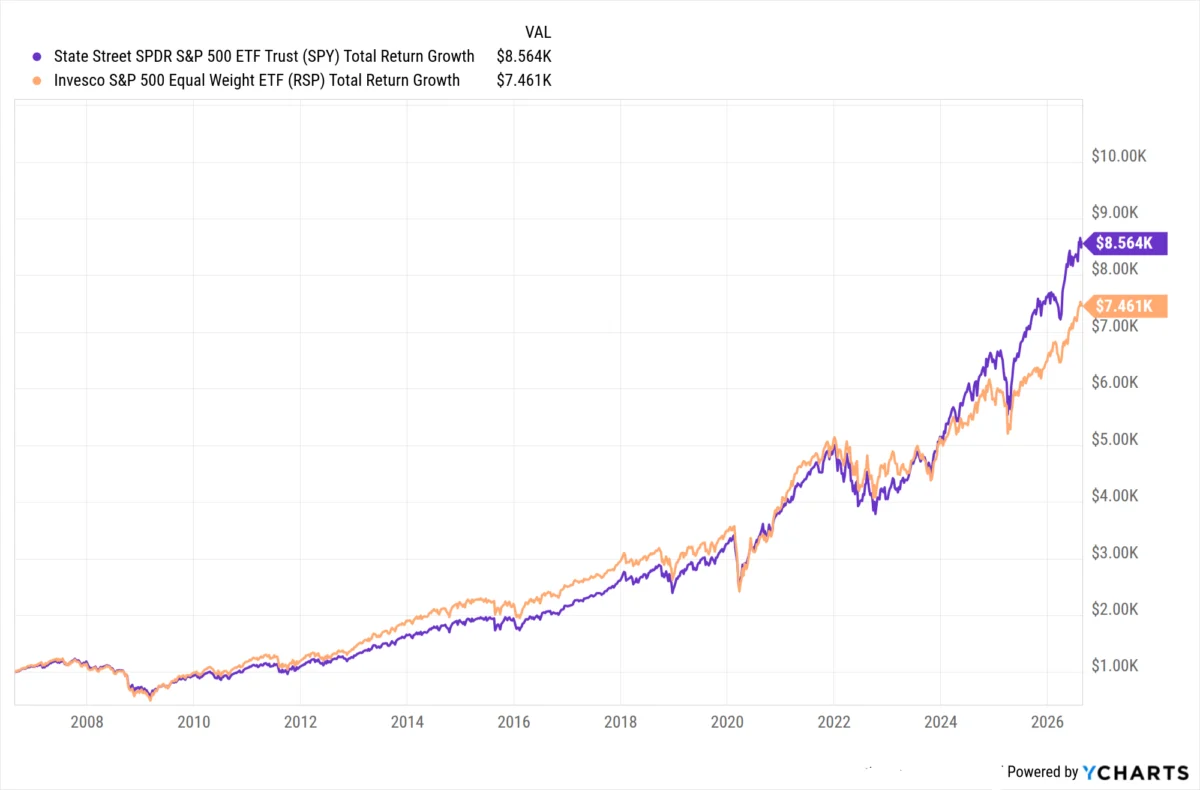
Looking back at a 20-year horizon, the results are telling. A $1,000 investment in the cap-weighted SPY twenty years ago would be worth approximately $8,600 today—a 750% return. The same $1,000 invested in the equal-weight RSP would yield roughly $7,500, or a 650% return.

The clear winner over the long term has been the cap-weighted approach. By its design, a cap-weighted index "lets its winners run." It automatically adjusts to give more weight to companies that are growing and shedding those that are failing. While this leads to the appearance of a "top-heavy" market, it is also what allows the index to capture the explosive growth of the most transformative companies in history.
Conversely, the equal-weight index provides broader exposure, which can serve as a hedge when Big Tech enters a correction phase. It is an excellent tool for investors who believe that the "market" is broader than just a few Silicon Valley titans and that the next decade will belong to companies currently residing in the mid-cap space.
The Bottom Line
While it is tempting to view the S&P 500’s reliance on a few dominant tech players as a sign of weakness, history suggests otherwise. Narrow breadth is the byproduct of a market that efficiently allocates capital to the most innovative and productive companies.
The fact that the equal-weight index is outperforming in 2026 is a healthy sign of market rotation, indicating that the bull market is broadening its base. However, for the patient, long-term investor, the evidence remains clear: fighting the cap-weighted index—and the Big Tech revolution that fuels it—is a losing proposition. The market’s tendency to consolidate around the most powerful innovations is not a risk to be avoided, but the very mechanism that makes the stock market the most effective wealth-building tool in history.
As investors look toward 2031 and beyond, the focus should remain on the underlying capacity for growth and innovation. Whether one chooses the concentration of the standard S&P 500 or the diversification of the equal-weight variant, understanding the "why" behind the market’s structure is the first step toward enduring success.