
Rain is more than just a weather phenomenon; it is a fundamental architect of regional identity, a driver of local ecosystems, and a critical factor in the modern real estate market. From the gentle, misty drizzles that define the Pacific Northwest to the sudden, torrential downpours characteristic of the American South, precipitation shapes how we live, where we build, and how we value our homes. As climate patterns shift, understanding the nuances of local rainfall has transitioned from a mere curiosity to a essential component of due diligence for prospective homebuyers and urban planners alike.
The Geography of Precipitation: Why Some Places Stay Soaked
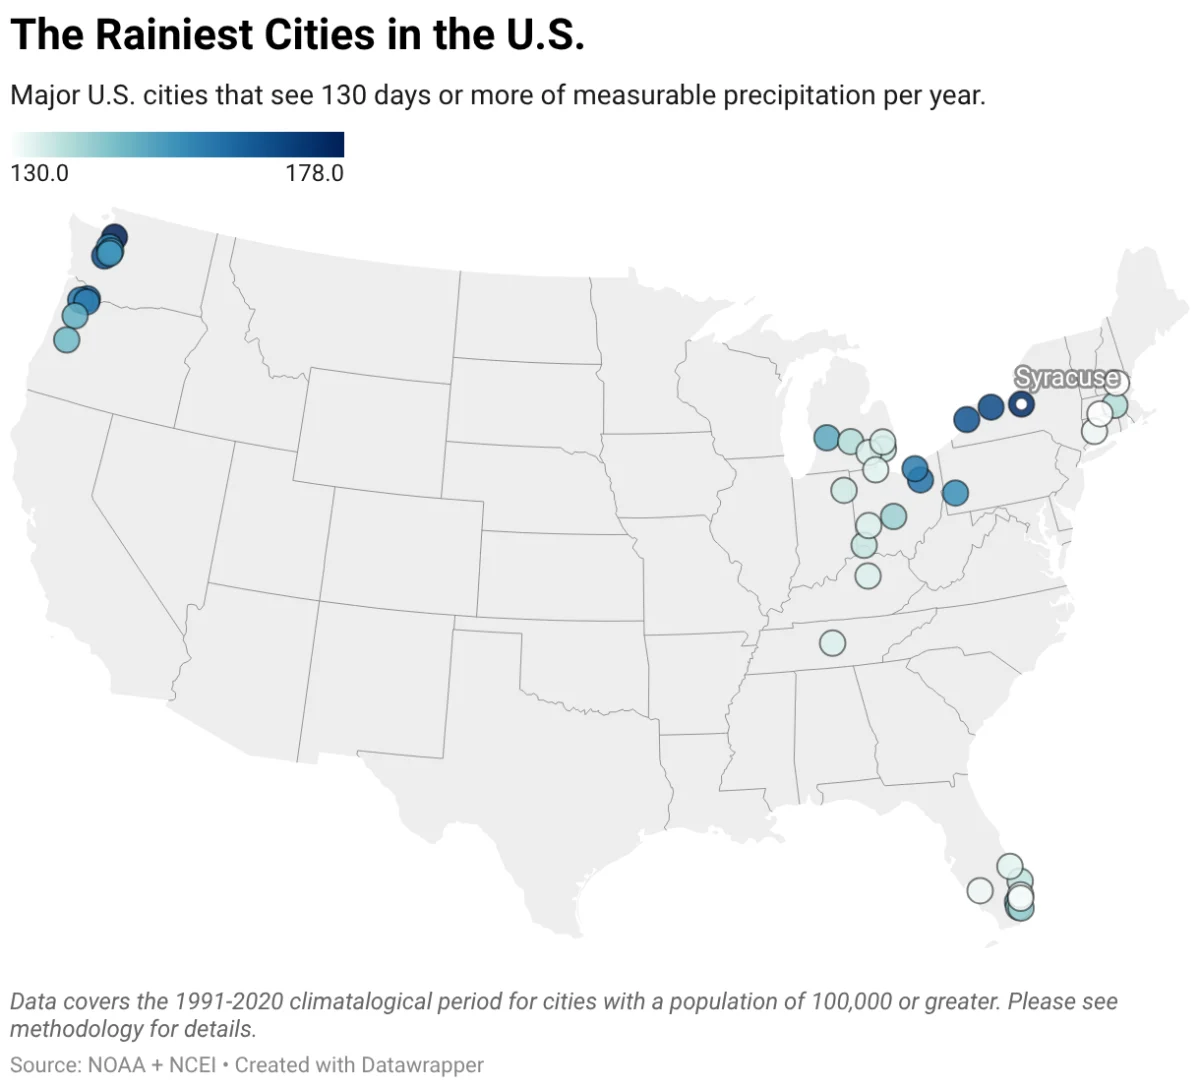
To understand the rainiest cities in the United States, one must look at the intersection of topography and meteorology. The wettest regions in the country are largely clustered in two distinct geographic zones: the Pacific Northwest and the Great Lakes corridor.
In the Pacific Northwest, the moisture originates over the vast expanse of the Pacific Ocean. Prevailing winds carry humid, low-pressure systems toward the coastline, where they encounter the uplift of the Olympic and Cascade mountain ranges. This process, known as orographic lifting, forces moist air to rise and cool, resulting in frequent, persistent, and often light rainfall that spans the fall, winter, and spring months.
Conversely, the Great Lakes region experiences a different phenomenon: lake-effect precipitation. During colder months, air moving from the west or northwest passes over the relatively warmer surface of the Great Lakes. As the air absorbs heat and moisture, it becomes unstable, leading to significant cloud cover and heavy rain—or snow—downwind. Cities like Buffalo, Rochester, and Syracuse are classic examples of this atmospheric engine, which consistently lands them on lists of the nation’s gloomiest, wettest cities.
Chronology of Climate Shifts
The narrative of American rainfall is not static. Since the dawn of the 20th century, we have observed a measurable shift in how, when, and where water falls across the continent. According to federal climate data, global precipitation has increased by approximately 0.08 inches per decade since 1901. However, within the lower 48 United States, the increase is more pronounced, rising at a rate of 0.17 inches per decade.
This is not merely a quantitative change; it is a qualitative one. Modern meteorology suggests that while some regions are seeing longer, more severe dry seasons, the wet seasons are becoming increasingly intense. The "dayslong drizzle" that once defined the Pacific Northwest is slowly giving way to more sporadic but powerful downpours. This shift, driven by a warming planet that holds more water vapor in the atmosphere, is fundamentally altering the risk profiles for homeowners in formerly "safe" regions.
Data Breakdown: America’s Rainiest Metropolitan Areas
When evaluating the rainiest cities, it is important to distinguish between the frequency of rain—measured in days of measurable precipitation—and the volume of rainfall.
Top Cities by Frequency (Measurable Precipitation)
Cities with high counts of rainy days often experience "gloom," where the sun is obscured by cloud cover for much of the year.
| City | Avg. Rainy Days/Year | Avg. Annual Precipitation |
|---|---|---|
| Everett, WA | 178 | 33.4" |
| Syracuse, NY | 174 | 39.9" |
| Tacoma, WA | 168 | 42.0" |
| Rochester, NY | 168 | 35.1" |
| Buffalo, NY | 166 | 40.7" |
| Vancouver, WA | 163 | 42.3" |
| Akron, OH | 160 | 41.6" |
| Hillsboro, OR | 159 | 35.9" |
| Cleveland, OH | 158 | 41.0" |
| Portland, OR | 157 | 36.9" |
Top Cities by Volume (Annual Total)
In contrast, cities in the American South often see fewer rainy days, but those days are characterized by high-intensity, tropical-style events that can dump several inches of water in a matter of hours.
- Hialeah, FL: 72.9 inches
- Miami, FL: 67.4 inches
- Mobile, AL: 67.1 inches
- Metairie, LA: 63.4 inches
- Lafayette, LA: 62.8 inches
These Southern cities operate under a different risk paradigm. While they may not be as "dreary" as their Great Lakes counterparts, they face significant threats from hurricane-related flooding and wind damage.
The Extremes: Beyond Major Cities
If we look beyond major metropolitan areas, the scale of precipitation becomes staggering. The title for the rainiest spot in the U.S. is generally held by the Big Bog in the Hana Forest Reserve of East Maui, which receives approximately 31.6 feet (379 inches) of rain annually. Mount Wai‘ale‘ale on the island of Kauai is another legendary contender, with some reports suggesting upwards of 450 inches of rainfall in peak years.
These extreme environments are fueled by the same orographic lifting seen in the Pacific Northwest but on a much more dramatic, tropical scale. Moist trade winds, uninterrupted by landmasses for thousands of miles, slam into the steep volcanic slopes of Hawaii, creating a nearly constant cycle of condensation and precipitation.
Official Perspectives and Insurance Implications
The increase in severe, short-duration rainfall has prompted a shift in how government agencies, such as NOAA and the NCEI, track weather data. The transition from 30-year averages to more granular, real-time climate risk assessments is becoming a priority for federal and local governments.
From an economic standpoint, the most significant implication is the hardening of the insurance market. As the frequency of floods and extreme weather events rises, insurance providers are adjusting their premiums to reflect these increased risks. In many parts of the country, particularly the Gulf Coast and parts of the South, flood insurance is becoming not only more expensive but, in some cases, increasingly difficult to secure.
Industry experts emphasize that "flood risk" is no longer a localized concern for those living in low-lying areas. With aging urban infrastructure and the increased intensity of "flash-flood" events, even properties miles from traditional floodplains are finding themselves vulnerable to rising water and overwhelmed storm drains.
Preparing for the Future: Implications for Homeowners
For those currently navigating the housing market, climate data is now as critical as school district ratings or commute times. Understanding a property’s specific climate risk—including its susceptibility to flood, extreme heat, and severe wind—is a vital step in the home-buying process.
Homeowners can take proactive steps to mitigate these risks:
- Infrastructure Maintenance: Keep gutters, downspouts, and local storm drains free of debris to ensure maximum drainage efficiency during peak rain events.
- Property Grading: Ensure the land around the foundation slopes away from the home to prevent water intrusion into basements or crawlspaces.
- Strategic Storage: Keep critical documents and high-value electronics above the ground level.
- Data Utilization: Leverage modern tools—such as those provided by real estate platforms that integrate climate risk data—to evaluate the long-term viability of a property.
Conclusion: Living with the Rain
Rain remains a vital component of the Earth’s natural systems, providing the water necessary for agriculture, industry, and daily life. While the "rainiest" cities offer unique cultural and environmental benefits, they also demand a higher level of preparedness from their residents.
As the climate continues to evolve, our relationship with precipitation must also change. By moving beyond the binary of "sunny vs. rainy" and embracing a more nuanced understanding of regional weather patterns, homeowners and policymakers can build more resilient communities. Whether you are chasing the sun or embracing the gloom, knowledge remains your most effective tool for navigating the changing environment of the American landscape.