
For decades, political analysts and market observers have obsessed over the "Stock Market Mount Rushmore," a metric used to rank U.S. presidents based on equity performance during their tenure. While the stock market is a potent indicator of investor sentiment and corporate health, it remains a niche barometer. According to recent Gallup polling, roughly 40% of American adults do not own stocks. However, every single American—regardless of their portfolio status—is an active participant in the economy through the purchase of essential goods and services.
If we want to evaluate a president’s impact on the average citizen, we must look at the metric that defines the household budget: inflation. From the cost of a gallon of gasoline to the price of a dozen eggs, the Consumer Price Index (CPI) is the ultimate arbiter of a president’s impact on the American kitchen table.
The Weight of the Wallet: Why Inflation Defines Legacies
Presidents are quick to claim credit for a bull market, but they are equally quick to deflect blame when the cost of living climbs. Yet, inflation remains the most visceral political force in the United States. It was the primary driver behind the Republican takeover of the House in 2022 and served as a central pillar in the 2024 presidential election. As we look toward the 2026 midterms, persistent inflation is already fueling projections of a political shift, proving that while elections are often won on ideology, they are frequently lost on the price of milk.
To understand how different administrations have navigated these waters, we have analyzed the average year-over-year growth of the Consumer Price Index for All Urban Consumers (CPI-U) for every presidency dating back to 1948.
Methodology: How We Measured the Price of Power
Our analysis utilizes the seasonally adjusted CPI, which strips away temporary fluctuations caused by holidays, extreme weather, or one-off sales events. By averaging the year-over-year growth figures for every month a president occupied the Oval Office, we have created a "presidential inflation score."
It is essential to provide a disclaimer: A president is not a central banker. While the White House exerts influence through fiscal policy, trade agendas, and executive appointments, the Federal Reserve remains the primary architect of inflation control through its manipulation of the federal funds rate. Furthermore, global phenomena—such as pandemics, geopolitical conflicts, and supply chain bottlenecks—often fall outside the control of any single administration. Being high or low on this list is a historical record of the environment a president oversaw, not necessarily a direct indictment or commendation of their specific policies.
A Chronology of Costs: Inflation Through the Decades
Jimmy Carter (1977–1981): The High-Water Mark
Leading our list with an average inflation rate of 9.75% is the Carter administration. His tenure is often cited as the textbook case of stagflation—a period of stagnant economic growth coupled with rapid price increases. The 1979 energy crisis, compounded by the Iranian Revolution, sent oil prices to unprecedented levels, effectively baking high inflation into the U.S. economy.
Gerald Ford (1974–1977): Managing the Fallout
Ford, who inherited an economy already reeling from the Nixon-era price controls and the 1973 oil embargo, saw an average inflation rate of 8.13%. His term was characterized by the "Whip Inflation Now" (WIN) campaign, an attempt to use public sentiment to curb rising costs, which ultimately proved insufficient against the structural economic pressures of the era.
The Modern Era: A Look at Recent Administrations
The contrast between the mid-century high-inflation era and the 21st century is stark. However, even in recent years, the variance between administrations has been significant.
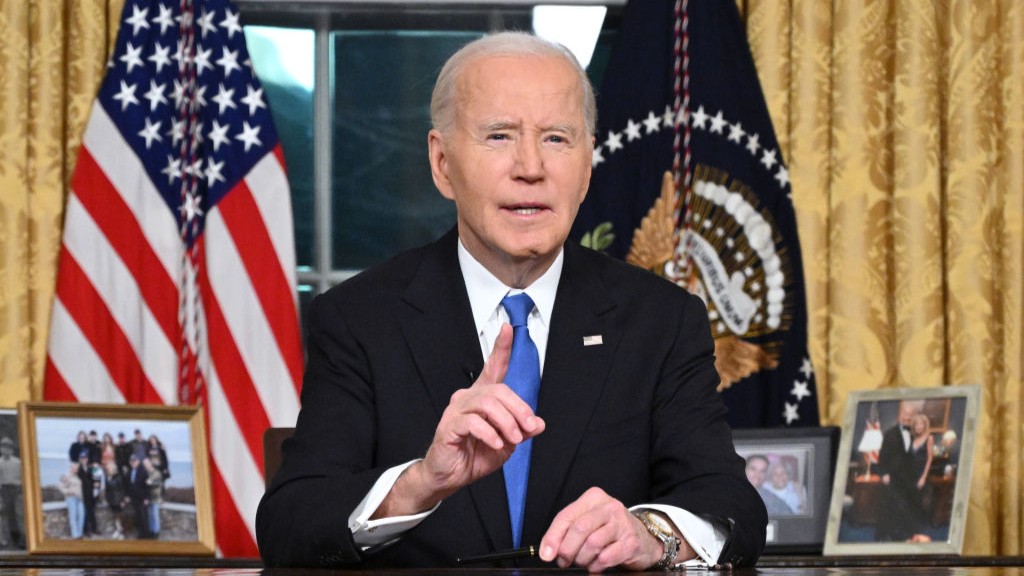
Joe Biden (2021–2025)
President Biden’s term stands out among recent presidencies, with an average inflation rate of 4.90%. The administration’s $1.9 trillion American Rescue Plan Act, intended to buffer the economy during the post-COVID recovery, became a flashpoint for debate regarding its role in overheating the economy. When combined with global supply chain failures and the energy price spikes following the Russian invasion of Ukraine in 2022, the result was a surge in CPI that peaked at 9.1% in June 2022. The subsequent aggressive interest rate hikes by the Federal Reserve successfully cooled the economy, bringing inflation back under 3% by the end of his term.
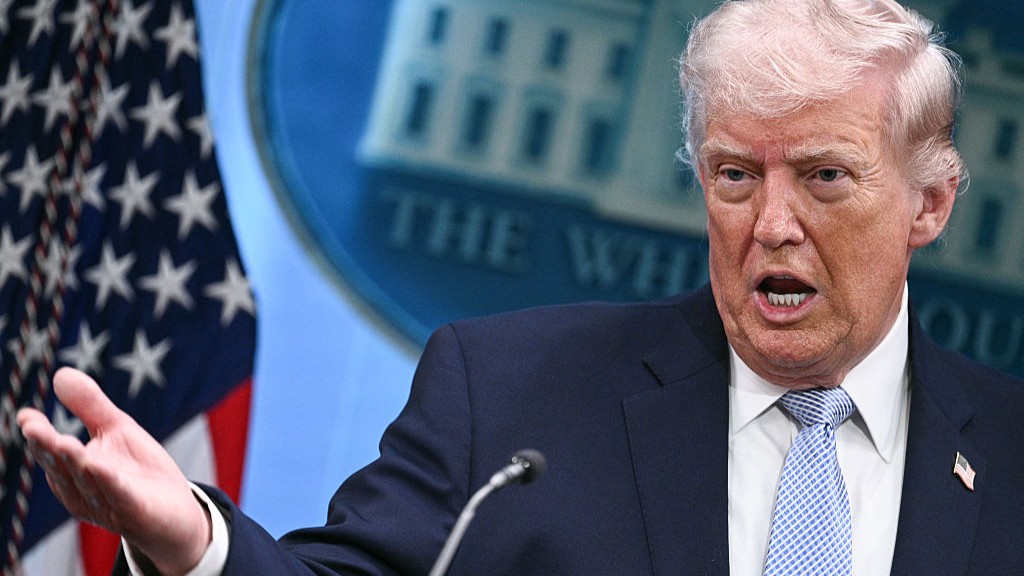
Donald Trump (Second Term, 2025–Present)
The second term of Donald Trump has been defined by a return to protectionist trade policies and regional conflict. The imposition of broad tariffs, which data from the Federal Reserve Bank of New York suggests were largely absorbed by domestic consumers, has created a unique inflationary environment. Furthermore, the 2026 war with Iran has destabilized energy markets, pushing fuel prices to record highs. As of late 2026, the administration is grappling with an inflation average of 2.98%, a figure that underscores the sensitivity of the U.S. economy to global oil volatility.
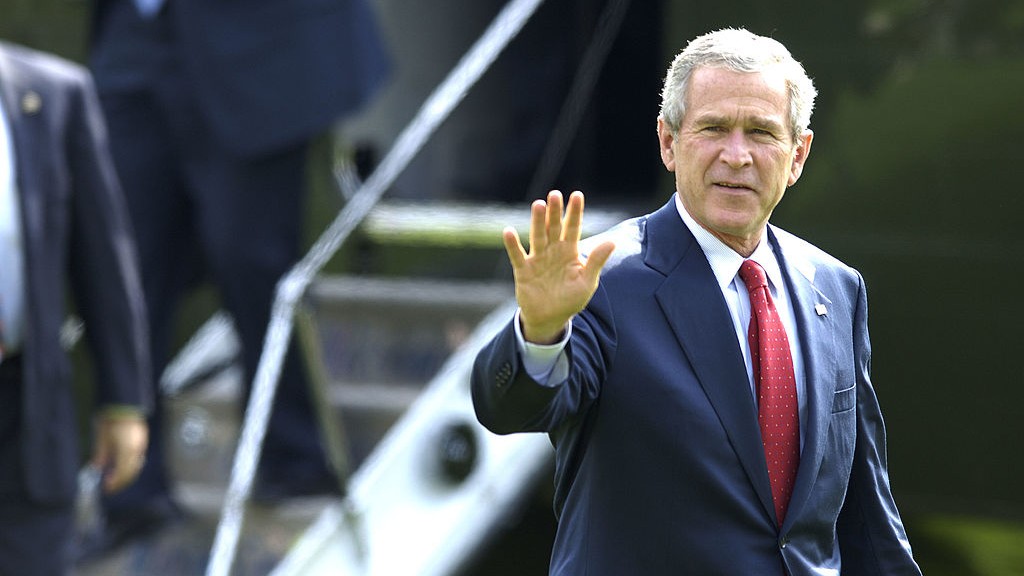
George W. Bush (2001–2009)
Bush’s two terms were a study in extremes. He began with the dot-com bubble collapse and the 9/11 attacks, prompting the Fed to slash interest rates to 1%. This, paired with tax cuts and the costs of two wars, fueled a credit-driven boom. By 2008, oil prices hit a record $147 per barrel, pushing inflation above 5%. However, the subsequent Great Recession caused a total collapse in demand, leading to an average inflation rate of 2.89% over his eight years.
Donald Trump (First Term, 2017–2021)
Trump’s first term was characterized by low and stable inflation, averaging 1.90%. A strong dollar, cheap energy, and a lack of wage-driven price pressure kept the CPI in check. Even with the introduction of various tariffs, the impact on headline inflation remained modest until the COVID-19 pandemic induced a global economic shutdown, which saw inflation briefly evaporate before the stimulus-fueled recovery began.
Barack Obama (2009–2017)
Barack Obama presided over the lowest inflation of any modern president at 1.39%. Inheriting the Great Recession, his administration faced the opposite problem of his predecessors: the threat of deflation. For most of his tenure, inflation remained stubbornly below the Federal Reserve’s 2% target, a sign of a sluggish recovery and weak consumer demand.
Supporting Data: Comparative Inflation Table
| President | Term | Average Inflation |
|---|---|---|
| Jimmy Carter | 1977-1981 | 9.75% |
| Gerald Ford | 1974-1977 | 8.13% |
| Richard Nixon | 1969-1974 | 5.66% |
| Joe Biden | 2021-2025 | 4.90% |
| Ronald Reagan | 1981-1989 | 4.66% |
| George H.W. Bush | 1989-1993 | 4.35% |
| Harry S. Truman | 1948-1953 | 3.57% |
| Historical Average | 1948-Present | 3.52% |
| Donald Trump (2nd) | 2025-Present | 2.98% |
| George W. Bush | 2001-2009 | 2.89% |
| Bill Clinton | 1993-2001 | 2.61% |
| Lyndon B. Johnson | 1963-1969 | 2.58% |
| Donald Trump (1st) | 2017-2021 | 1.90% |
| Barack Obama | 2009-2017 | 1.39% |
| Dwight D. Eisenhower | 1953-1961 | 1.36% |
| John F. Kennedy | 1961-1963 | 1.15% |
Official Responses and Economic Policy
The debate over inflation policy remains deeply partisan. Supporters of current and past administrations often point to "exogenous factors"—events outside of presidential control—to explain spikes in the CPI. For example, the Biden administration consistently highlighted the role of global supply chain disruptions caused by COVID-19 as the primary driver of 2022’s inflation. Conversely, critics of the Trump administration argue that the implementation of tariffs functions as a tax on American consumers, directly contributing to higher costs for imported goods.
The Federal Reserve, however, maintains a stance of institutional neutrality. By adjusting the federal funds rate, the Fed attempts to keep the economy in a state of "Goldilocks"—not too hot, not too cold. The tension between the White House’s desire for growth and the Fed’s mandate for price stability is a constant feature of the American economic landscape.
Implications for the Future
The historical data suggests that inflation is rarely the result of a single policy. It is a complex ecosystem of global trade, consumer confidence, monetary policy, and resource availability.
As we look toward the future, the implications are clear:
- The "Inflation Tax": Higher average inflation, as seen in the late 70s or the early 2020s, functions as a regressive tax, disproportionately affecting those on fixed incomes and the working class.
- Policy Responsiveness: The ability of an administration to work with, rather than against, the Federal Reserve is critical. When fiscal policy (government spending) and monetary policy (interest rates) are aligned, the economy tends to be more stable.
- Geopolitical Vulnerability: The reliance on global supply chains and foreign energy sources makes the U.S. inflation rate susceptible to international conflict. As seen in the Trump and Bush eras, energy prices remain a massive wild card that can derail even the most carefully crafted domestic economic plans.
Ultimately, while the Stock Market Mount Rushmore might tell us who made investors the wealthiest, the Inflation Ledger tells us who protected the purchasing power of the American family. As voters head to the polls in future cycles, it is this ledger—the silent, persistent climb of prices—that will likely continue to be the most influential factor in determining who stays in the White House and who is sent home.